Posted: August 28, 2024
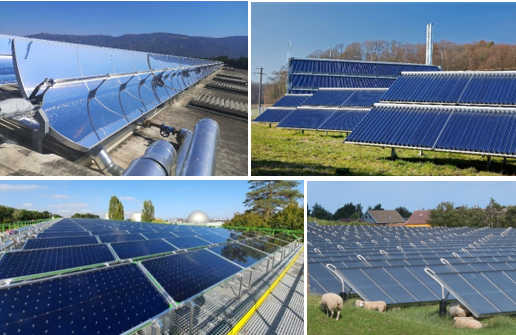
Photos: Solites, Erik Christensen, solarheateurope.eu, solitermgroup.com
A large number of different collector types are available for planners to integrate into district heating systems. A recent report by the IEA Solar Heating and Cooling Programme titled Solar Collector Technologies for District Heating analyses and compares stationary and tracking collector types in terms of geometry, efficiency and costs. This report is based on an industry survey and will make it easier for district heating system operators to get an overview of the available collector technologies particularly for supply temperatures between 80 and 120 °C. Numerous authors from research and project development worked together on the report under the direction of Silas Tamm and Magdalena Berberich from the German research institute Solites. It is published on the website of Task 68 - Efficient Solar District Heating Systems at https://task68.iea-shc.org/Data/Sites/1/publications/IEA-SHC-Task68--Report-RA1.pdf.
The authors want to widen the perspective on solar district heating opportunities: “Up to now, high-performance flat-plate collectors and evacuated tube collectors have been state of the art for the integration of solar heat into district heating networks operating at medium temperatures between 80 and 120 °C. However, other collector technologies, such as parabolic troughs and linear Fresnel collectors, can provide heat in a wider temperature range and might offer greater efficiency at different temperature levels and other advantages over the currently used systems, such as tracking and the possibility to control the heat yield,” as it says in the executive summary of the report.
Geometry of collector types
The first feature analysed is the geometry of the collectors. Those with a large gross area are particularly interesting for extensive collector fields, as they are quicker to install. On the other hand, collectors with a smaller size are easier to install, for example on roofs or areas which have special geometries or interruptions in the available surface.
The following table shows 15 selected collector suppliers with the gross collector area of their products. Suppliers of large concentrating collectors build entire rows of elements that track together, creating units of over 800 m2. However, there are also smaller concentrating collectors with gross areas of 36 m2 from Protarget, 9.13 m2 from Soliterm and 6.04 m2 from Absolicon. In the centre of the table are the large-sized stationary flat-plate and vacuum tube collectors with areas of between 13 and 16 m2. The PVT collector from Abora and the high-vacuum flat-plate panel from TVP Solar are only available in units of 2 m2 each.
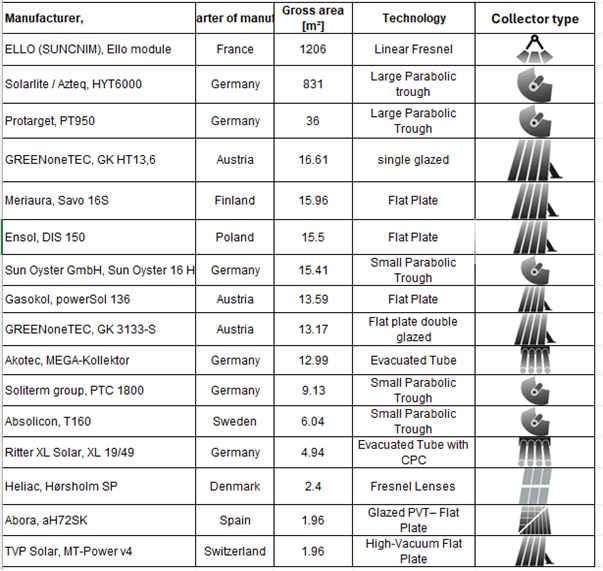
Gross collector area of different solar collectors according to manufacturers´ information.
Source: Adapted from table in Task 68 report Solar Collector Technologies for District Heating
Collector efficiency curves
The second comparison criterion in the report is the efficiency curve. The achievable thermal output of solar collectors is limited by the optical and thermal losses. While the optical losses are independent of the temperature, the thermal losses can be modelled as a parabolic curve dependent on the difference between the average collector temperature and the ambient temperature. In principle, the following applies: higher collector temperatures result in greater differences to the temperature of the ambient air. This leads to higher heat losses and thus to lower efficiencies. Therefore, all the efficiency curves decrease as the temperature difference increases.
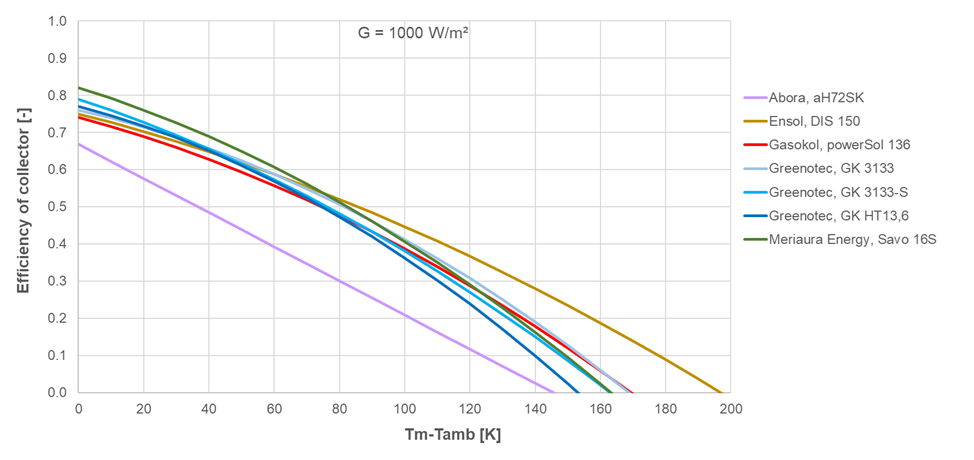
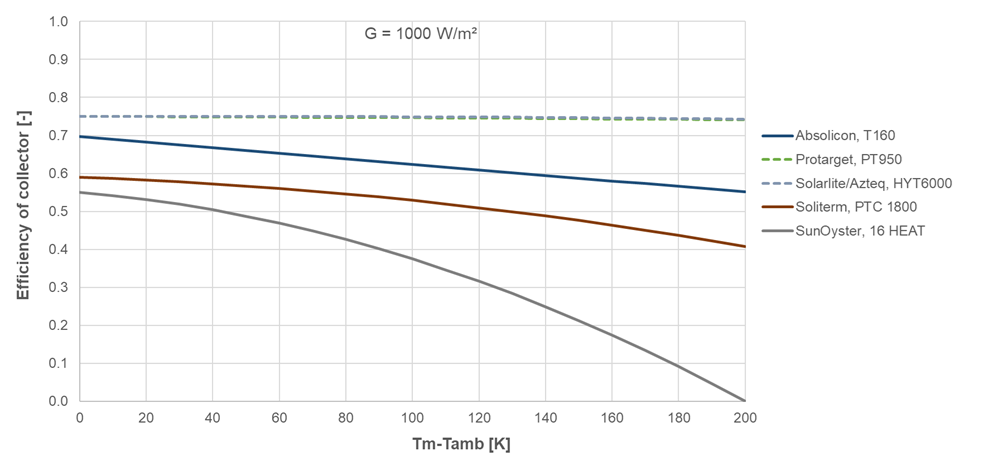
Figure 1: Selected efficiency curves for stationary flat-plate collectors (above) and parabolic trough collectors (below). In the lower diagram the two dotted curves are overlapping. The following applies to all efficiency curves in the report: solid lines are based on Solar Keymark certificates and dotted lines are based on manufacturer information.
Source: Task 68 report Solar Collector Technologies for District Heating
Efficiency curves can look very different, as figure 1 shows. The parabolic trough collectors have much flatter efficiency curves than the flat-plate collectors. Due to the relatively small absorber tube diameter, the heat-emitting surface of concentrating collectors is smaller than that of flat-plate or evacuated tube collector technologies, sates the report. This results in lower thermal losses and therefore higher efficiency at higher collector temperatures. Large parabolic trough collectors with vacuum receivers have almost no drop in efficiency in the shown temperature range up to 200 °C. The authors of the report emphasize, however, that flat-plate collectors are an inexpensive, widely proven and established technology that is available from numerous manufacturers and production facilities in Europe.
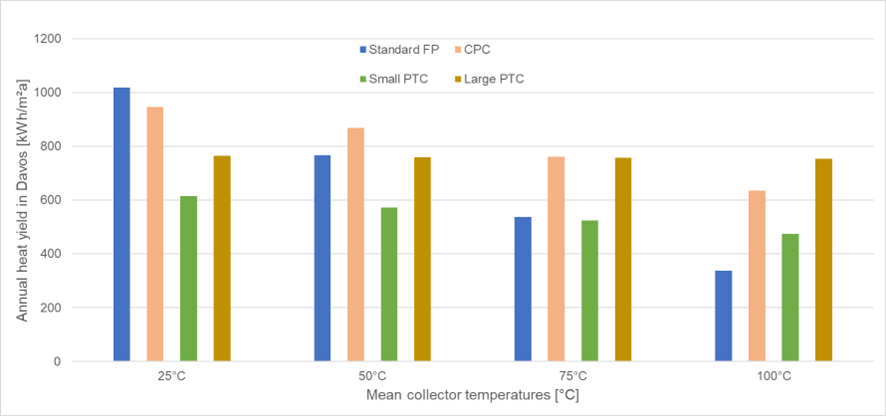
Figure 2: Comparison of gross thermal yield in Davos, Switzerland, for different operating temperatures based on Solar Keymark certificates (up to 75 °C) and ScenoCalc calculations (at 100 °C). CPC stands for vacuum tube collectors with a compound parabolic concentrator.
Source: Task 68 report Solar Collector Technologies for District Heating
Gross thermal yield comparison
The third comparison criterion in the report is the gross thermal yield (GTY) as indicated by Solar Keymark certificates for different operating temperature levels or calculated by ScenoCalc based on efficiency data from the manufacturer. The (GTY) is a measure of collector performance when operated at a fixed temperature and orientation throughout the year in a given climate.
Figure 2 illustrates averaged GTY values for one collector model which is representative of the four illustrated collector types at the location of Davos in Switzerland. It can be seen that the flat-plate collector delivers the highest specific yields at a mean collector temperature of 25 °C, whereas the concentrating collectors achieved a better performance at temperatures above 50 °C. The figure also shows that evacuated tubes with CPC (compound parabolic concentrators) are efficient and well-suited to medium-high supply temperature applications. These results are directly related to the efficiency curves shown in the previous section of the report.
Websites of organizations mentioned in this news article: